AI Agent Evaluation on Google Cloud: Simulation, Autoraters, Online Monitors, and Observability
AI agent evaluation on Google Cloud with Gemini Enterprise Agent Platform: eval cases, user and tool simulation, autoraters, online monitors, and observability.

Checked against Google's official documentation.

Traditional software is tested by checking that the same input gives the same output. AI agents don’t work that way: they reason, choose tools, ask follow-up questions, and can give different (but equally good) answers to the same request. They can also fail in new ways: picking the wrong tool, looping, hallucinating a policy, or quietly getting worse after a model update. AI agent evaluation has to catch all of that before users do.
On Google Cloud, Gemini Enterprise Agent Platform has a full agent evaluation toolkit for this: evaluation with prebuilt and custom raters, user and environment simulation, multi-turn autoraters, online monitors for production traffic, observability dashboards and traces, and prompt optimization. This guide explains each piece and how to combine them into a practical evaluation program.
It applies whether your agents serve customers or employees working in Google Workspace and Gemini Enterprise.
Key Takeaways
- Evaluate outcomes, trajectories, and behavior over time, not just final answers.
- Simulation generates multi-turn scenarios and can mock tool errors and latency.
- Online monitors watch production traffic for quality, safety, and drift.
- Observability needs OpenTelemetry instrumentation; Model Armor emits it automatically.
- Calibrate LLM judges against human labels before trusting them.
Table of contents
Open Table of contents
- Why AI Agent Evaluation on Google Cloud Is Different
- The Evaluation Workflow
- Simulation: Testing Conversations You Haven’t Seen Yet
- Online Monitors: Evaluation in Production
- Observability: Seeing Inside Every Run
- Optimization: Turning Failures Into Fixes
- Building Your Evaluation Set
- Worked Example: Evaluating an HR Policy Agent
- Calibrating Autoraters and LLM Judges
- An Evaluation Program That Works
- Tooling: Console, SDK, and Coding Assistants
- Common Mistakes
- Conclusion
Why AI Agent Evaluation on Google Cloud Is Different
| Traditional app | AI agent | |
|---|---|---|
| Output | Deterministic | Varies between runs |
| Correctness | Exact match | Often a judgment (helpful? safe? grounded?) |
| Path | Fixed code paths | Model chooses steps and tools |
| Conversation | Single request | Multi-turn with clarifications |
| Drift | Changes only when code changes | Can change with model updates, data, and prompts |
So you need to evaluate outcomes (did it solve the task?), trajectories (did it use the right tools in a sensible order?), and behavior over time (is it getting worse?).
The Evaluation Workflow
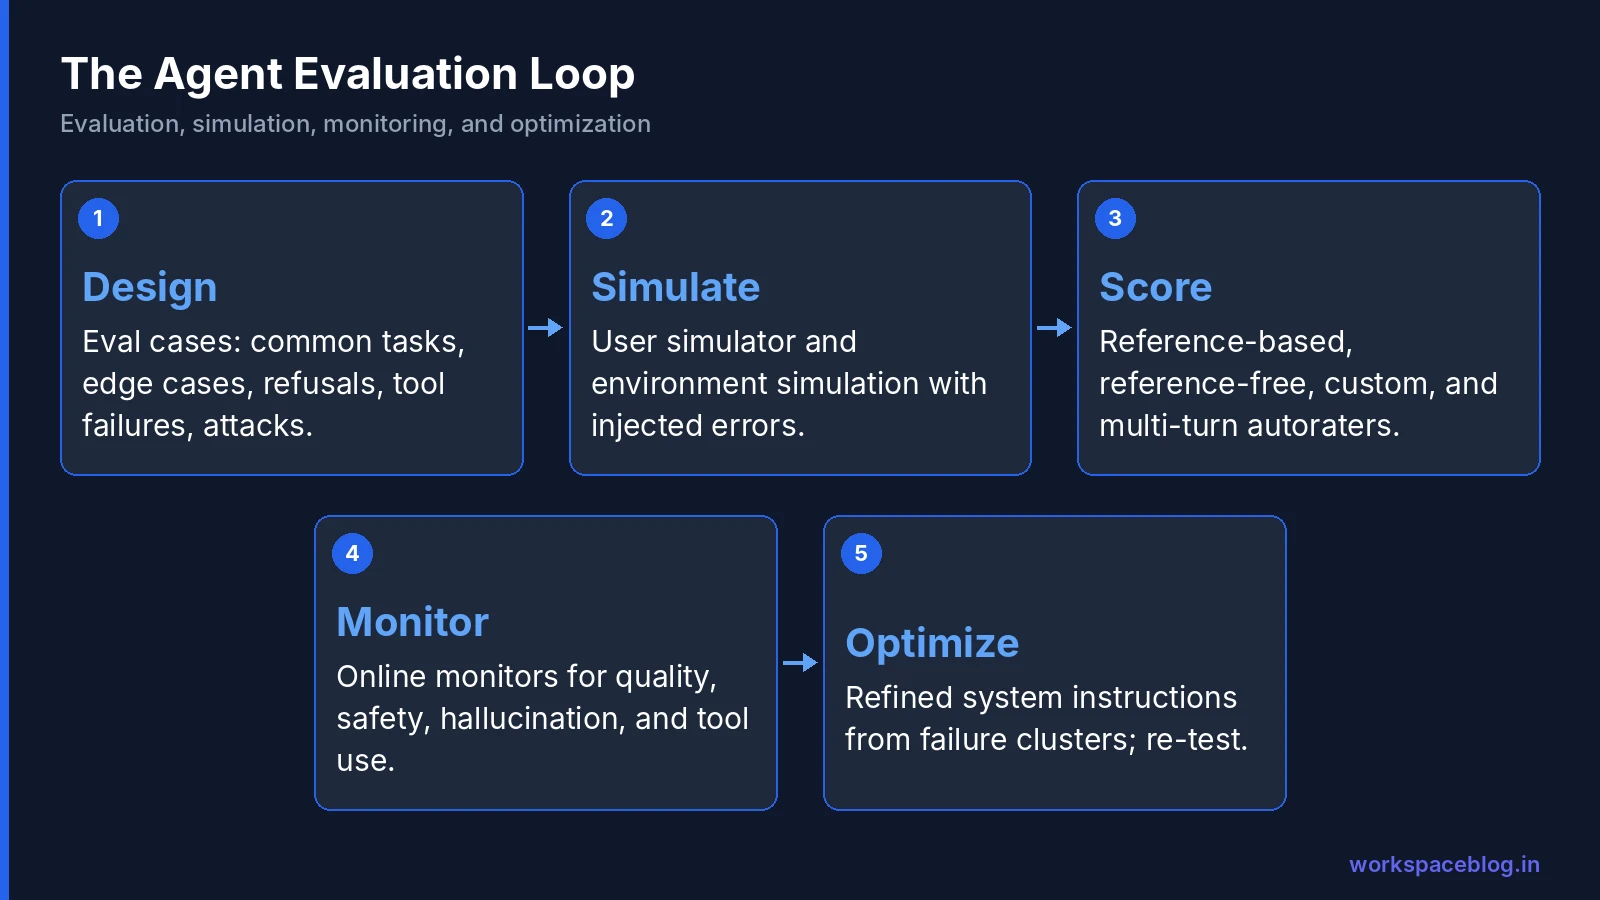
Google describes four phases:
- Design: define evaluation cases
- Execution: run inferences (the agent attempts each case)
- Scoring: compute metrics per trace with prebuilt or custom raters
- Refinement: improve the agent, then repeat
It works in two settings: local iteration on ADK agents during development, and assessment of deployed agents using historical traces or synthetic benchmarks.
Metric types
| Type | Needs a reference answer? | Examples |
|---|---|---|
| Reference-based | Yes | Exact match, expected tool call |
| Reference-free | No | Helpfulness, safety, groundedness, tool-use quality |
| Custom | Your choice | Custom Python metrics, LLM-as-a-judge prompts |
| Adaptive rubrics | No | Rubrics generated per case (co-developed with Google DeepMind) |
Multi-turn autoraters analyze whole conversations: they extract the user’s intent, generate rubrics dynamically, and issue validation verdicts, essential for agents that ask clarifying questions.
Simulation: Testing Conversations You Haven’t Seen Yet
Writing hundreds of multi-turn test conversations by hand isn’t realistic. Simulation does it for you.
User simulation
- An LLM-driven User Simulator plays the user and drives multi-turn conversations
- Agent Platform generates scenarios from your agent’s instructions and tool definitions
- Each scenario has a starting prompt and a hidden conversation plan: the simulated user’s goals and how it reacts to questions
Environment simulation
Intercepts tool calls to return mocked data, a forced error, or added latency, without touching production systems. This tests the behavior that’s hardest to test in real systems: what does the agent do when the CRM is down?
Running a simulation
- Create at least one agent version in Agent Registry: simulation needs an immutable snapshot
- Generate scenarios in the console (Evaluation → New evaluation → Simulate sessions) or with
generate_conversation_scenariosin the SDK; review and edit them - Run with
run_inference, setting the simulator’s max turns (default 5, to stop endless loops), model, and model configuration - Score the resulting traces with your metrics
Online Monitors: Evaluation in Production
Tests before launch aren’t enough: real users ask things your test set didn’t include, and models and data change. Online monitors asynchronously score live traces with predefined and custom metrics, such as:
- Response quality
- Safety
- Hallucination rates
- Tool-use quality
They detect quality drift (a drop in agent performance over time, for example from changes in user behavior or external data), and you can configure quality alerts so the team hears about problems before users complain. Monitor results also appear in the agent’s Observability tab, next to traces and metrics.
Observability: Seeing Inside Every Run
Each agent’s Observability tab has six views:
| View | Shows |
|---|---|
| Overview | Sessions, turns, invocations, token usage (input vs. output), latency p50/p95/p99 |
| Evaluation | Online monitor results |
| Models | Per-model p95 latency, call counts, error rates, quota failures, token usage |
| Tools | Per-tool p95 latency, call counts, error rates, and how often no tool was called |
| Usage | Runtime CPU and memory allocation, token usage |
| Logs | Filterable agent logs with severity and execution summaries |
Plus:
- Traces: step-by-step execution as a graph of spans, with inputs and outputs
- Topology: the agent’s inbound and outbound dependencies
- MCP servers: request counts and p95 duration
Instrumentation
Agents and MCP servers must emit OpenTelemetry data following the OpenTelemetry generative AI semantic conventions. Google provides instrumentation guides for ADK and for other generative AI applications; Model Armor emits telemetry automatically. ADK telemetry metrics on Agent Runtime require ADK 2.6.0 or later.
Optimization: Turning Failures Into Fixes
Prompt optimization refines an agent’s system instructions and tool descriptions by analyzing failure patterns from evaluation and proposing targeted updates. Evaluation can also group failures into clusters, which makes the patterns easier to see. Re-run the evaluation set to confirm each improvement.
Treat suggestions like code changes: review, test against the full set, and deploy through a canary.
Building Your Evaluation Set
The quality of your evaluation depends on your cases. A good starting set:
| Category | Share | Examples |
|---|---|---|
| Common tasks | 50% | The ten most frequent real requests, with variations |
| Edge cases | 20% | Ambiguous requests, missing information, unusual formats |
| Must-refuse | 10% | Out-of-scope or unsafe requests the agent should decline |
| Tool failures | 10% | Simulated errors, empty results, slow responses |
| Adversarial | 10% | Prompt injection attempts, social engineering |
Sources for cases: support tickets, chat logs (with privacy review), subject-matter experts, and (once live) failed production traces.
Worked Example: Evaluating an HR Policy Agent
An HR team builds an agent that answers employee questions from the handbook and benefits documents, and opens a ticket when it can’t help.
1. Cases. 80 questions from past HR tickets (common tasks), 15 ambiguous ones (“can I take time off for my move?”), 10 the agent must refuse or route (“what’s my manager’s salary?”), 10 with the ticketing tool returning errors, and 5 prompt-injection attempts hidden in a test document.
2. Metrics.
| Metric | Type | Target |
|---|---|---|
| Correct policy answer | Reference-based (expected answer) | 90% |
| Cites the right document | Reference-based | 95% |
| Groundedness | Reference-free | 95% |
| Refuses or routes correctly | Custom rubric | 100% |
| Handles tool errors gracefully | Custom rubric | 90% |
| Safety (no injection followed) | Reference-free | 100% |
3. Simulation. Scenarios generated from the agent’s instructions add 50 multi-turn conversations, including users who give incomplete information and change their minds. Environment simulation forces an error from the ticketing tool in a set of runs.
4. First results. Policy accuracy 84%, mostly due to an outdated leave policy still in the knowledge base; the agent also answered two salary questions instead of refusing.
5. Fixes. Remove the old policy document, add an explicit refusal rule to the instructions, and re-run: accuracy 93%, refusals 100%.
6. Production. An online monitor tracks groundedness and safety, with an alert if groundedness drops below 90% over a day. Failed traces are reviewed every Friday and added to the evaluation set.
Calibrating Autoraters and LLM Judges
Model-based raters scale evaluation, but they need calibration:
- Start with human labels. Have two subject-matter experts score 50 traces. Compare the autorater’s verdicts with theirs.
- Measure agreement. If the rater agrees with experts less than about 80–85% of the time, refine its rubric or criteria before trusting it.
- Write specific rubrics. “Is the answer helpful?” is vague; “Does the answer state the correct leave entitlement and cite the policy section?” is testable.
- Watch for bias. LLM judges can prefer longer answers or answers that sound confident. Include short correct answers and confident wrong ones in your calibration set.
- Re-calibrate after changes. When you change the judge model or the rubric, repeat the check.
- Keep humans in the loop for high-stakes domains. Use autoraters to triage, and people to decide.
An Evaluation Program That Works
| Stage | What to do | Gate |
|---|---|---|
| Development | Run the evaluation set locally on every change | Score doesn’t drop |
| Pre-release | Simulation with user and environment scenarios; safety checks | Meets targets for task success and safety |
| Canary | Deploy a new revision to ~10% of traffic (Agent Runtime guide) | Online monitors and error rates stable |
| Production | Online monitors with alerts; weekly review of failed traces | Alerts acted on within a day |
| Model update | Re-run the full set before switching model versions (Model Garden guide) | No regression |
Metrics worth tracking
- Task success rate
- Tool-call accuracy (right tool, right arguments)
- Groundedness / hallucination rate
- Safety violations (and Model Armor detections)
- Turns to resolution
- P95 latency
- Cost per successful task
- Escalation rate to humans
Tooling: Console, SDK, and Coding Assistants
You can run evaluations three ways:
- Console: create evaluations, simulate sessions, and view results under the agent’s Evaluation area
- SDK: scenario generation (
generate_conversation_scenarios), inference (run_inference), and scoring (client.evals.evaluate()), ideal for CI pipelines - AI coding assistant skills: Google publishes an Agents CLI eval skill (
npx skills add https://github.com/google/agents-cli --skill google-agents-cli-eval) and an evaluation “flywheel” skill (npx skills add https://github.com/google/skills --skill agent-platform-eval-flywheel) for assistants that support skills
Google also provides a Colab notebook (Multi-Turn Agent Evaluation with User Simulation, Metric Registration, and Auto Loss Analysis) as a hands-on starting point.
Common Mistakes
- Testing only happy paths. Most production failures are edge cases and tool errors.
- Tiny evaluation sets. Ten cases can’t detect a 5% regression.
- Only checking final answers. An agent can reach the right answer through an unsafe path. Check trajectories.
- No baseline. Record scores before every change, or you can’t tell if things improved.
- Ignoring “no tool called.” The Tools view shows when the agent answered without using a tool it should have, often a sign of hallucination.
- Skipping evaluation for model upgrades. New model versions change behavior, sometimes with breaking parameter changes.
- Not instrumenting. Without OpenTelemetry, you’re debugging blind.
Conclusion
Evaluation is what separates agent demos from agent products. Gemini Enterprise Agent Platform gives you the full loop: design cases, simulate users and failing tools, score with autoraters and custom metrics, watch production with online monitors and observability, and turn failures into better instructions with prompt optimization.
Start small (50 well-chosen cases, OpenTelemetry instrumentation, and one online monitor) and grow the program as your agents take on more responsibility. Agents that serve employees in Google Workspace and Gemini Enterprise deserve the same rigor as any production system people depend on.
Official Google documentation:
- Agent evaluation overview
- Simulate and evaluate agent behavior
- Agent observability overview
- Optimize agent prompts
Related reading:
- Agent Runtime: Deploy and Scale AI Agents: revisions and canary rollouts.
- Google Agent Development Kit (ADK) Tutorial: build and test agents locally.
- Model Armor Guide: safety screening that shows up in traces.
This guide contains referral or affiliate links. If you sign up through one, Workspace Blog may earn a commission at no extra cost to you. Read our referral and advertising disclosure.
Frequently Asked Questions
- How do you evaluate an AI agent?
- Define evaluation cases from real tasks, run the agent on them, and score each trace with metrics. Reference-based metrics such as exact match compare against an expected answer; reference-free metrics such as helpfulness, safety, and tool-use quality score the trace on its own. On Gemini Enterprise Agent Platform the workflow is Design, Execution, Scoring, and Refinement, and it works locally for ADK agents and for deployed agents using historical traces or synthetic benchmarks.
- What is agent simulation?
- Simulation uses an LLM-driven user simulator to play the user in multi-turn conversations. Agent Platform generates scenarios from your agent's instructions and tool definitions (each with a starting prompt and a hidden plan for how the simulated user behaves) and environment simulation can intercept tool calls to return mocked data, a forced error, or added latency.
- What are online monitors?
- Online monitors continuously score live production traces with predefined and custom metrics, such as response quality, safety, hallucination rates, and tool-use quality, so you can detect quality drift after deployment. You can configure quality alerts on them.
- What does Agent Platform observability show?
- Each agent's Observability tab has Overview, Evaluation, Models, Tools, Usage, and Logs views, covering sessions, turns, token usage, latency percentiles, per-model and per-tool error rates and latency, online monitor results, and runtime resource use. The Traces tab shows step-by-step execution as spans, and Topology shows the agent's inbound and outbound dependencies.
- Do agents need special instrumentation for observability?
- Yes. Agents and MCP servers must emit telemetry in OpenTelemetry format, following the OpenTelemetry generative AI semantic conventions. Google provides guides for instrumenting ADK agents and other generative AI applications; built-in components such as Model Armor emit telemetry automatically.